

Q2 2026 is the quarter where the fine wine market quietly completed something important. After two years of correction, a year of stabilisation, and six months of recovery - the balance of power between buyers and sellers has now shifted. In Q1 2026, buyers were still in control: they had options, they negotiated discounts, they waited. In Q2 2026, sellers started holding firm. Discounts to list price narrowed. US buyers began paying above market price. Asian buyers surged 159% in a single week. Italy hit its highest ever quarter share of trade. This is not just momentum. This is a structural change in market conditions - and the Q2 report documents it in remarkable detail.
Section 01 -The Single Most Important Data Point in This Report
From -9% to +1.1%: The Price Gap That Tells You Everything
The most technically significant number in the entire Q2 2026 report is not a wine price. It is the average gap between what buyers are paying on Liv-ex versus the published market list price. Watch this number move across 18 months.
Average % Difference Between Trade Price and Market Price - Fine Wine 1000
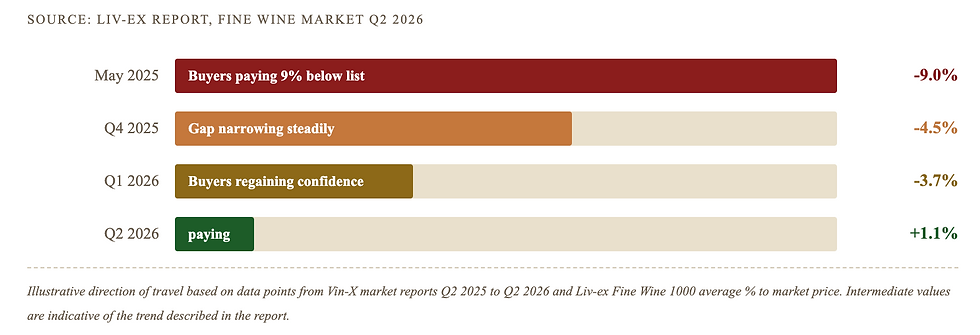
Think of it this way Imagine a property market where sellers were accepting 9% below asking price during a downturn. Buyers had all the power. Slowly, as the market recovered, that discount shrank - to 5%, then 3%. Now, in Q2 2026, US buyers are paying 1.1% above asking price. That is not a recovering market anymore. That is a seller's market beginning to form. When buyers start paying premiums, the next move in prices is up. |
The key driver of this shift: US buyers. The report notes that US acquisitions were transacted at an average 1.1% above market price in Q2, up from just 0.03% above in Q1. They are paying premiums because they need European fine wine to replenish stocks- and a strengthening dollar makes European prices look attractive relative to what they pay at home.
Section 02 — Global Buyers in One Picture
Who Was Buying and When — The Geography of Demand
Breakdown of Buyer Geography -10 to 16 July 2026

The Asia number is the one to focus on. In the week of 10-16 July, Asian buyers accounted for 18.2% of all Liv-ex trade value - their highest share in recent years - with their purchase sum rising 159% week-on-week. They accounted for 40% of all Champagne purchasing in that period. When Asian buyers enter the market at scale, historically it has preceded sustained price appreciation in the highest-value wines.
Section 03 — The Wines With Consistent Upward Price Trends
Ten Wines That Rose Every Quarter — Regardless of Market Noise
The report includes a remarkable table: wines that showed consistent upward price movement comparing Q2 2025 to Q2 2026. These are not wines that jumped on a single piece of news. They rose steadily, across a full year of recovery. This is the data investors rely on most.

Mouton Rothschild alone appears three times - the 2005, 2010, and 2015 vintages all rose consistently year-on-year. The report names Mouton Rothschild as the top performing brand by this measure, producing three of the top ten wines. That is not vintage luck. That is producer prestige compounding across multiple years.

Section 04 — H1 2026 Top Performers
The Five Best Performing Wines in the First Half of 2026

Rhone takes the top two spots. Paul Jaboulet Hermitage La Chapelle 2020 is the single best performing wine across all regions in the first half of 2026 at +39.8%. Chateau Rayas 2008 at +37.5% is second. Both are Rhone wines - from a region whose index is still showing slight negative readings. This is the classic disconnect between the index and individual wine performance, and it is where the real opportunity sits.
Section 05 — Region by Region
Six Regions. Six Different Stories. One Direction.

Section 06 — The Rhone Paradox
Index Down -1.4%. Best Performing Wine in the Market. Both True at Once.
The Rhone story in H1 2026 is the clearest illustration of why reading only the index can mislead you. The Rhone 100 index dropped -1.4%. The region's individual wines led the entire fine wine market in H1 performance. How is this possible?
Think of it this way Imagine a school where the average exam score is 62% - but three students scored above 95. The average looks mediocre. The outliers are exceptional. The Rhone index reflects the average performance of 100 Rhone wines. A handful of names - Jaboulet Hermitage La Chapelle, Chateau Rayas, E. Guigal - are delivering returns that bear no relationship to the index average. The index is not wrong. It is just the wrong tool for understanding these specific wines. |
Rhone - Index vs. Individual Wine Reality

Section 07 — Five-Year View
Where Patient Capital Has Built Real Wealth

Bonneau du Martray Corton Charlemagne 2013 at +159.3% over five years means: £20,000 invested five years ago is now worth approximately £51,860. Domaine Leflaive Chevalier-Montrachet 2015 has more than doubled at +102.3%. Three Burgundy wines have crossed 100% or more. Salon Le Mesnil 2007 has risen 61.7%. These are not lucky outliers. They are the consistent result of world-class producers, finite supply, and a global buyer base that keeps growing.
Section 08 — What This Quarter Means for You
Current Investors and New Investors — The Same Direction, Different Starting Points
If you already hold fine wine The market has structurally shifted in your favour
| If you are considering entering The structural shift has happened -but you are still buying before the next leg up
|


All data sourced exclusively from Vin-X Market Report Q2 2026 and Liv-ex.com. All illustrative examples, charts, and calculations are clearly marked as such throughout. This article is for informational and educational purposes only and does not constitute financial advice. Past performance is not indicative of future returns. Capital at risk.
Comments